Play video

Play video
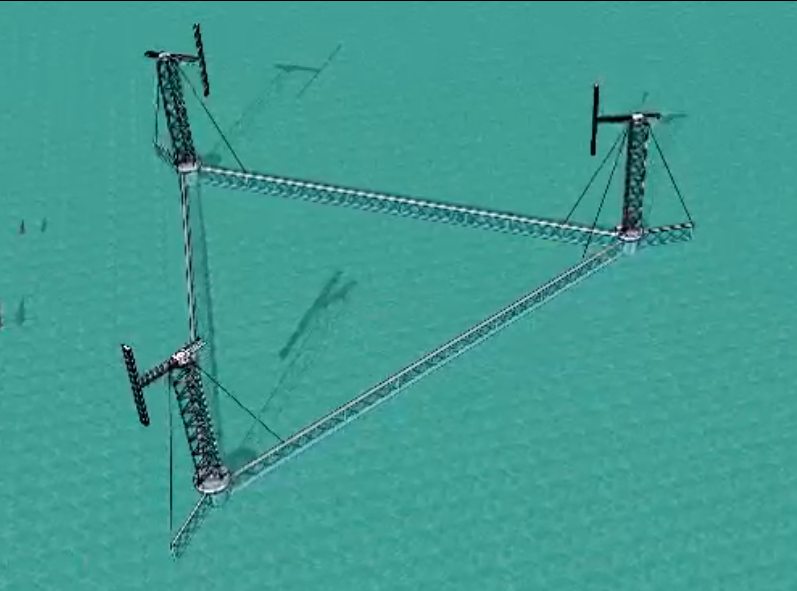
Lattice tower is low mass, guyed and is transparent to wind and waves. Single blade has maximum chord, thickness, strength, stiffness and efficiency. Blade speed is uniform and low over entire blade length. Relative airspeed is always lower than HAWT to avoid noise and blade erosion
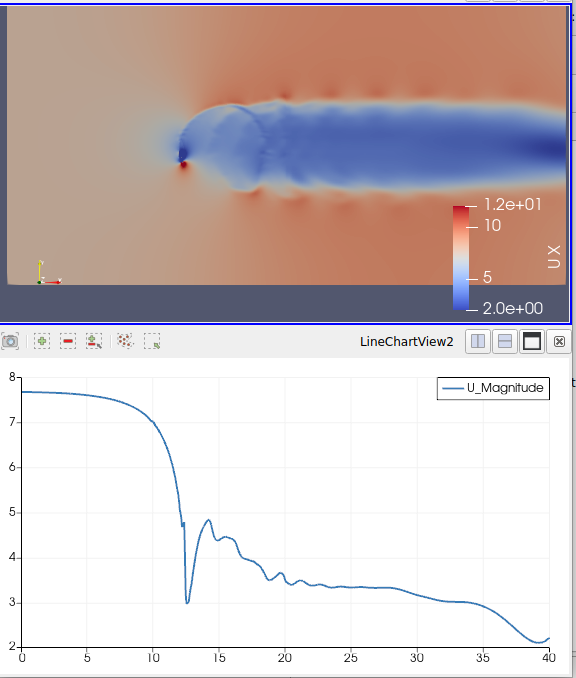
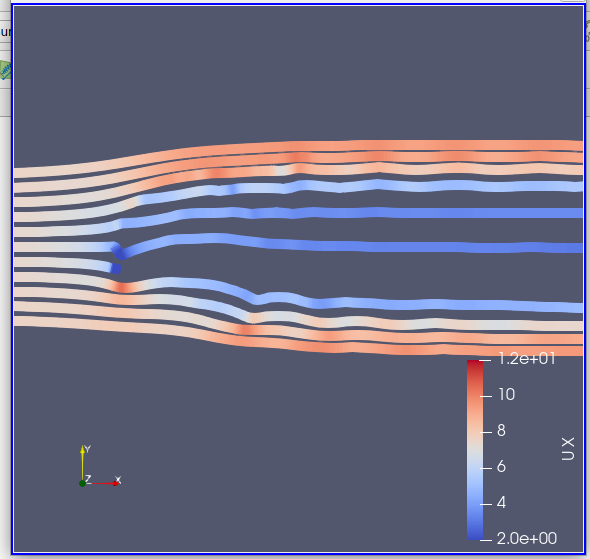
Do not trust any supplier that cannot show a CFD simulation of the turbine at the actual wind speeds of your proposed site, or does not state the capture area (as seen by a horizontal wind flow) and the efficiency at the mean windspeed for the proposed site. Capture area and efficiency at site mean windspeed will allow you to compute any turbines likely annual energy capture performance in your own spreadsheet.
The mechanical forces and bending moments can be computed for any part of the blade and the actual deflections expected can be computed for various choices of material and box section skin thickness.
It is critical for long term safety, efficiency and reliability, that the operating conditions such as rotational speed are monitored and managed and that the turbine is halted if dangerous or abnormal conditions are detected such as high winds, fracture of the blade, or vibration. We have designed power electronics, sensors, and microcontroller software to correctly manage and monitor all conditions and report regularly to a database visualised on the internet.
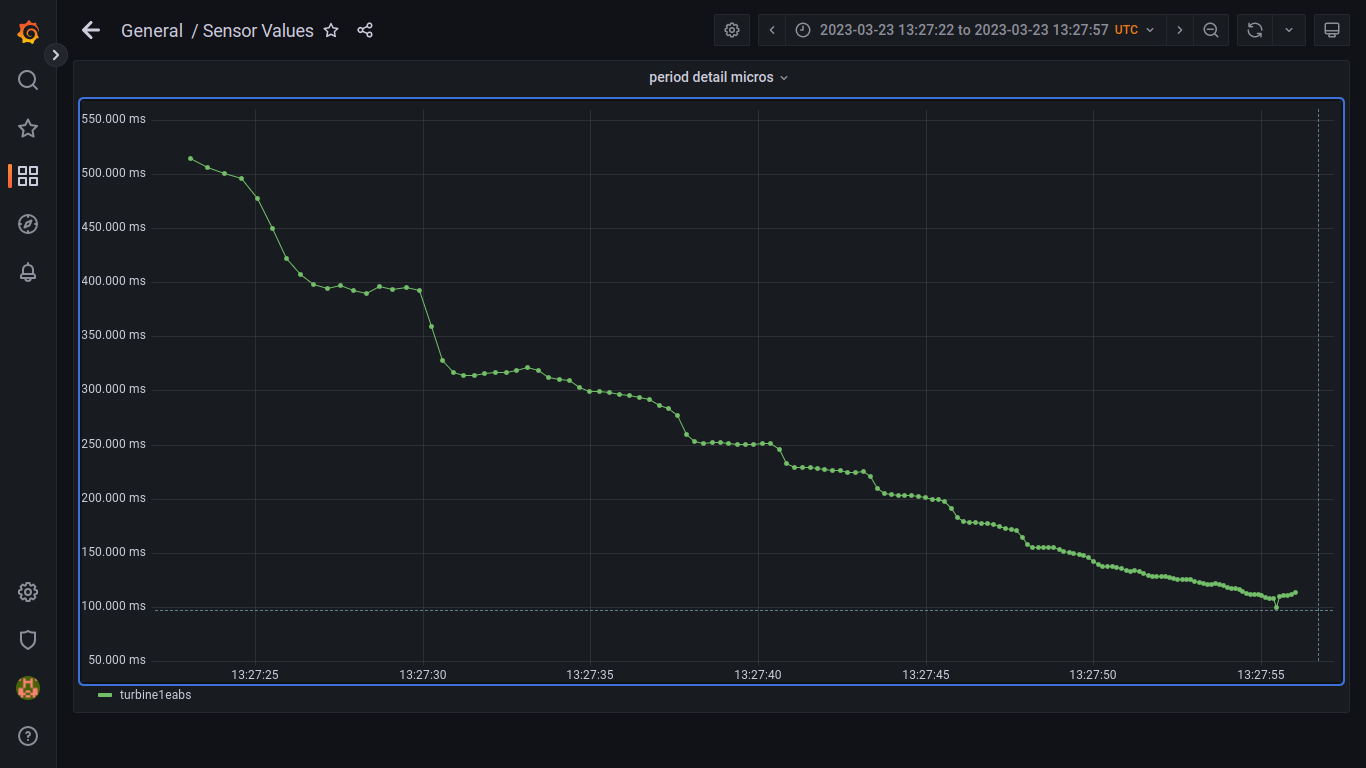
E.g. Monitoring the period of the electrical AC cycle from the generator during purely wind powered startup with a resolution of 12 points per rotor revolution shows the kinetic energy of the wind being captured by the blade at particular segments of a rotor revolution.
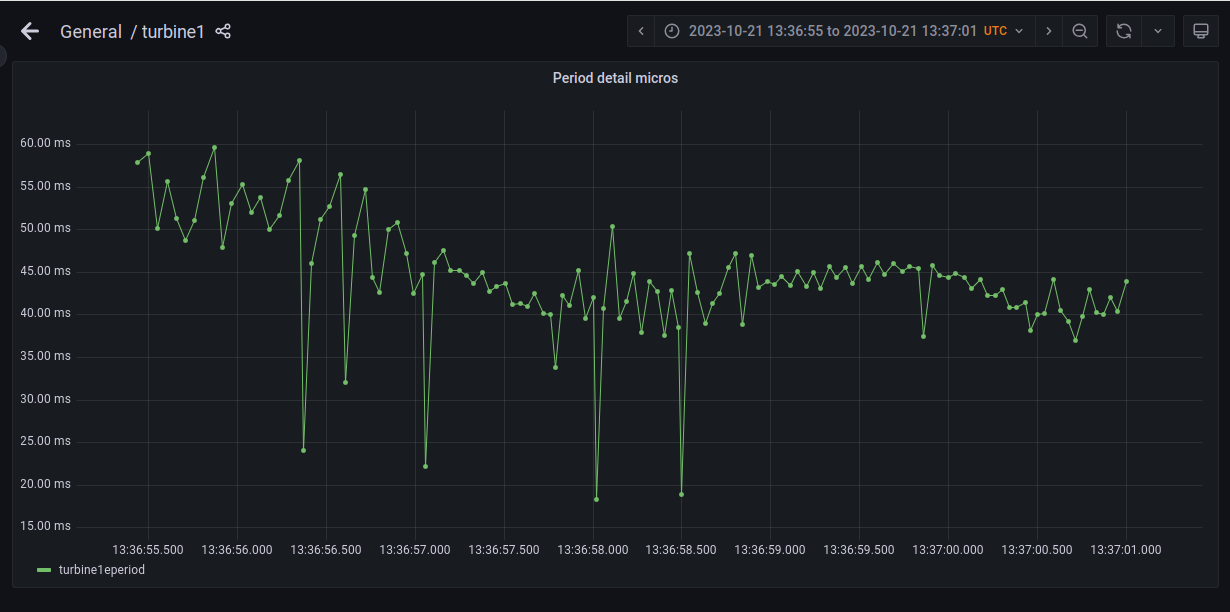
E.g. Monitoring the period of the electrical AC cycle from the generator during fast winds with power generation with a resolution of 12 points per rotor revolution shows the kinetic energy of the wind being captured by the blade at particular segments of a rotor revolution summed with constant extraction of the energy as electricity. Any difference between input and output energy gets stored briefly as kinetic energy in the rotor.
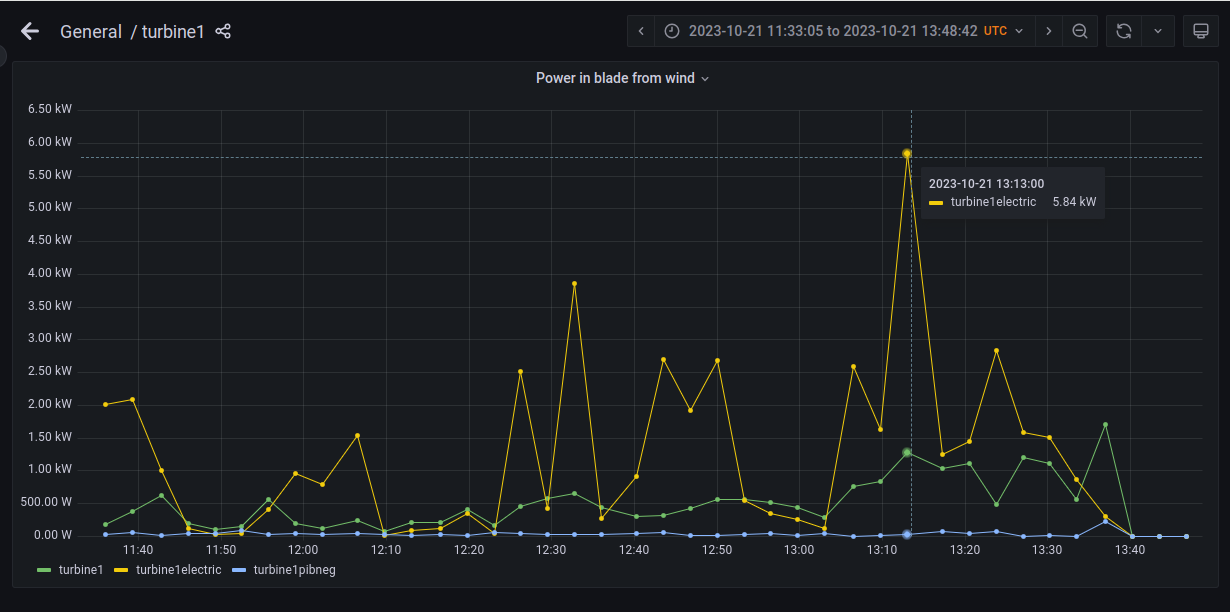
E.g. Monitoring the power entering the blade and leaving as electrical power from the generator.
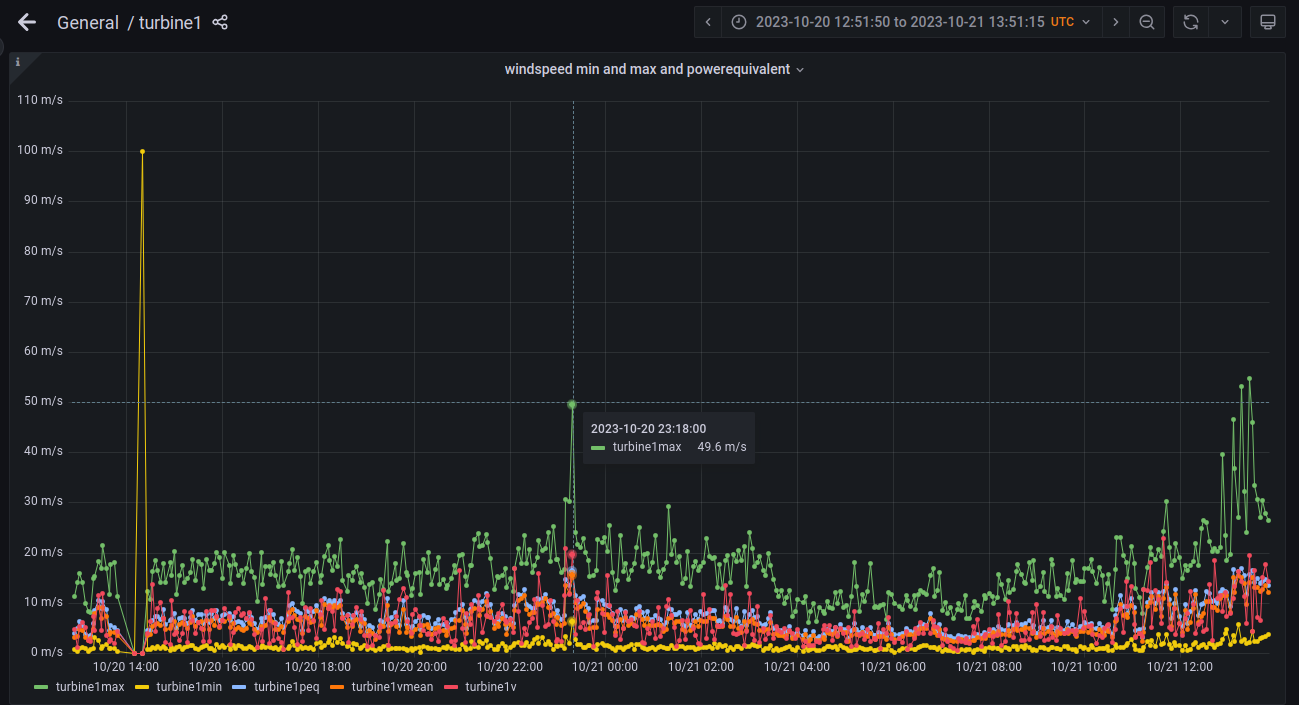
E.g. Monitoring the windspeed at the turbine using an anemometer, and computing averages, maximums, spot value and power equivalent windspeed which is the windspeed that, if constant, would generate the same power as the fluctuating present mean windspeed.
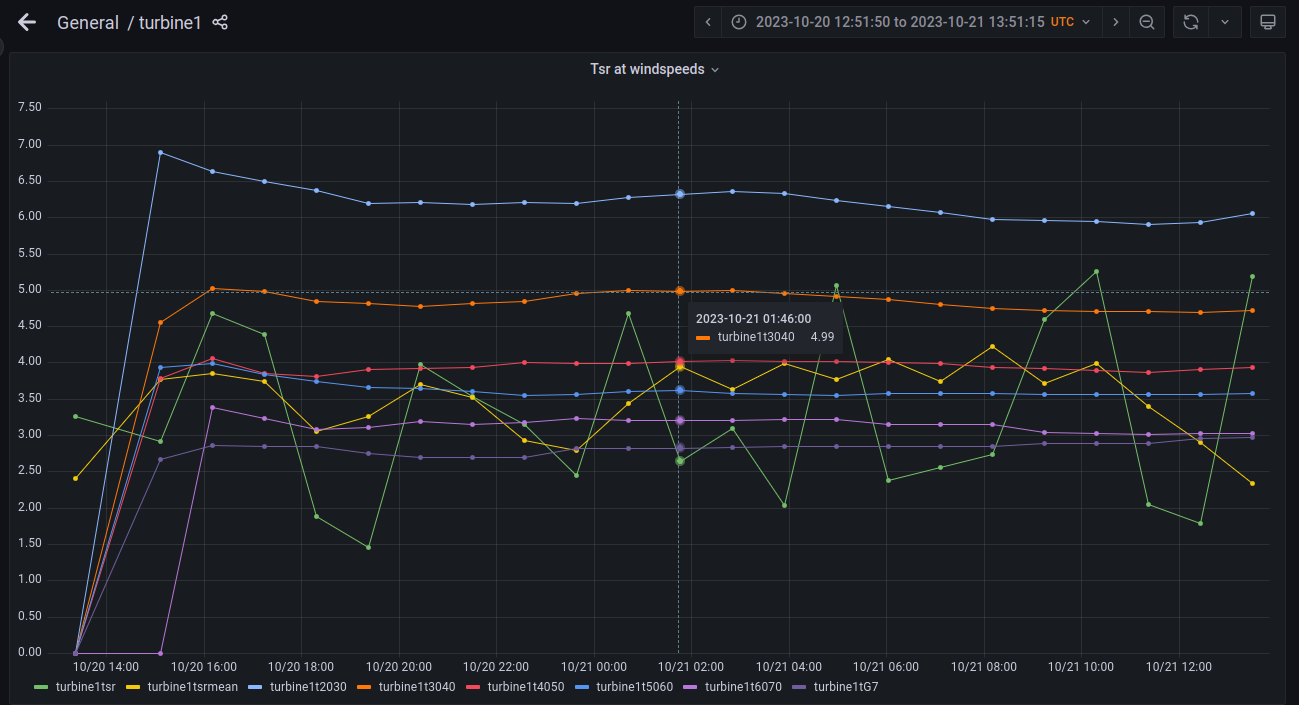
E.g. Computing the average tip speed ratio (TSR) at various windspeeds. If the turbine runs at a restricted speed, then the TSR will drop as the wind increases speed as seen in this plot.
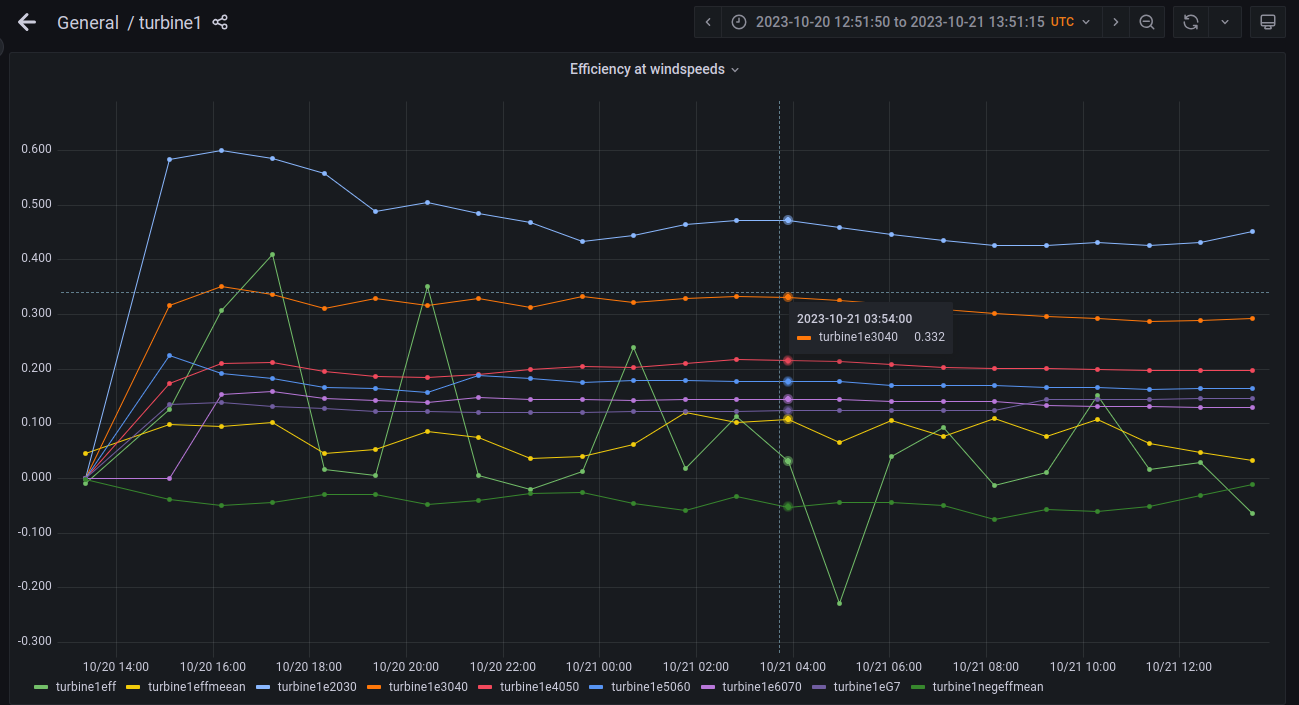
E.g. Computing the turbine efficiency at ranges of windspeeds. The efficiency improves at lower windspeeds because the TSR is greater at lower windspeeds and efficiency is strongly related to TSR.
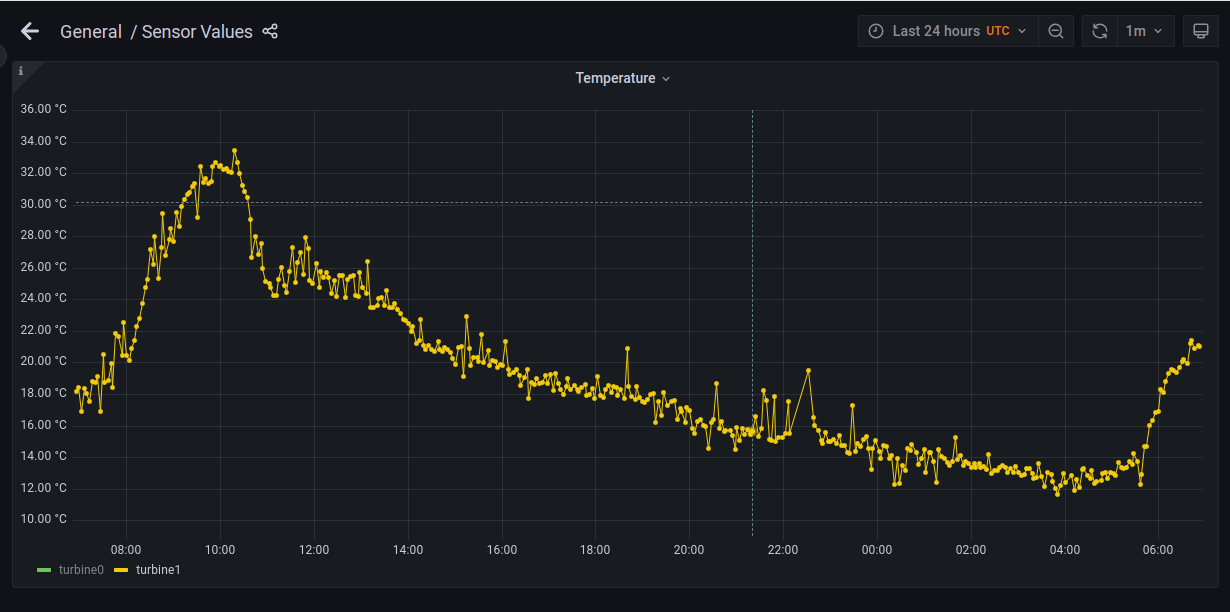
E.g. Monitoring the temperature of the electronics board over 24 hours.
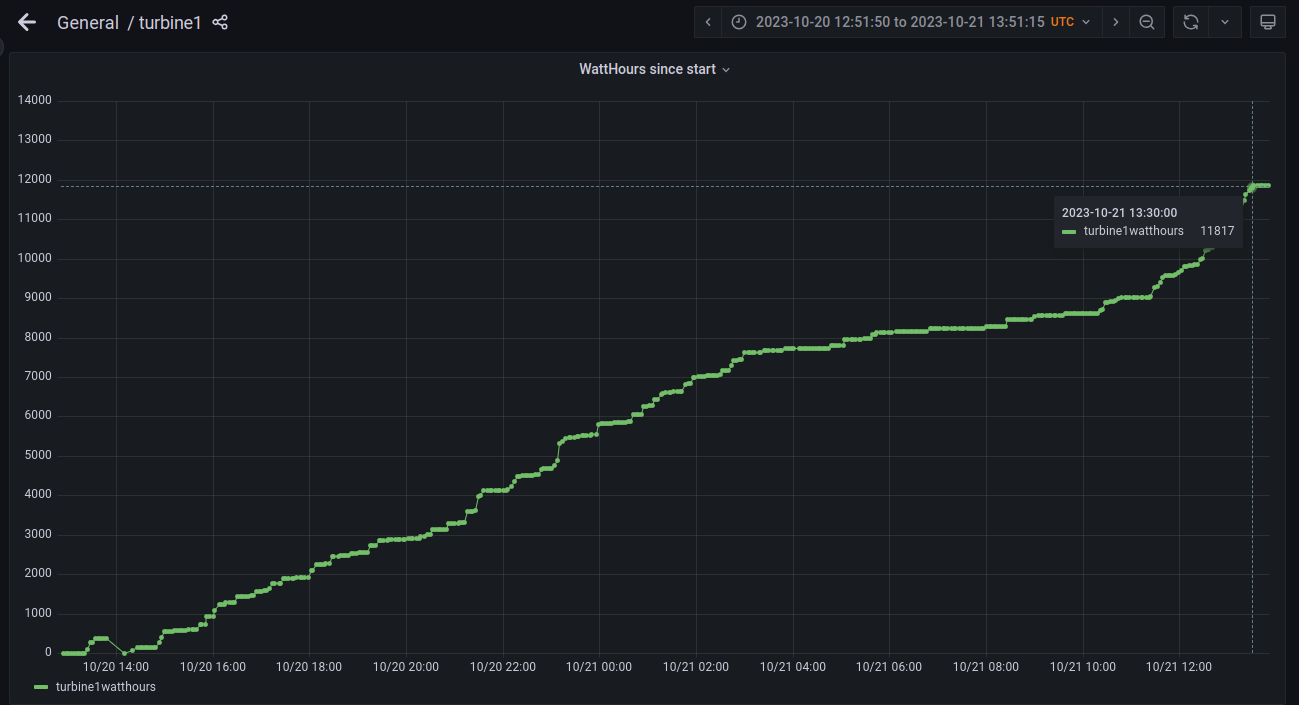
E.g. Computing the cumulative watt hours of energy harvested from the wind over 2 days.